
The Hidden Warehouse Complexity
2026 Operational Requirement Benchmark for the Small and Medium-Sized Business (SMB) Market
We studied 100 companies on NetSuite that were actively evaluating warehouse management technology. We were looking for the common threads. What we found revealed that the standard filters used to evaluate warehouse operations — revenue, headcount, and order volume — do not describe what those warehouses actually require.
 The SMB Warehouse Operations Gap
The Five Levels of Warehouse Complexity
Hidden Complexity & Pain Dimensions
The Four Warehouse Operator Profiles Defined by What's Breaking
Profile 1: Analog Operator
Profile 2: Throughput Ceiling
Profile 3: Regulated Operator
Profile 4: Full System Breakdown
Why Warehouse Management Systems Fail
Download the PDF
How Hidden Warehouse Complexity Surfaced
We Were Looking for the Common Threads
We studied 100 companies on NetSuite that were actively evaluating warehouse management technology. We were looking for the common threads: what these operations shared, where the patterns were, and what was driving them to seek a solution.
What we found was that 46 of those 100 companies had already implemented a warehouse solution before this evaluation. Of that group, 65% reported their system lacked the functionality their operation required.
That finding shaped everything that followed. A cohort this size arriving at a replacement evaluation — after already investing in warehouse technology — raised a question the data was well-positioned to examine: what was the gap between what these operations required and what their existing systems delivered?
The Key Finding
The majority of companies in this sample fall below $25 million in annual revenue. 79% classified at Standard warehouse complexity or above. The gap between those two numbers is the central finding of this report. Operational requirements that are real and demanding do not disappear because the company generating them is small. This is what this study documents as hidden warehouse complexity: operational requirements that are present and measurable, yet not visible to the revenue and headcount filters the market typically uses to classify them.
This sample was drawn from a single direct lead source that trends toward smaller operations and excludes partner-led evaluations, which tend to involve larger and more complex operations. The revenue distribution in this sample reflects that sourcing constraint and should not be read as representative of the broader SMB warehouse market.

Key Statistics
What the Data Showed Across All 100 Companies
Each of the following figures was documented at the company level
across 100 NetSuite evaluations conducted in 2026 across North America.

79% Standard Complexity or Above
As classified by the Warehouse Complexity Index — based on operational requirements, not revenue

89% Reported Manual Processes
Including 46% that already had warehouse technology deployed. Owning a system and having a system that eliminates manual work are not the same thing.

68% Disconnected Systems
No real-time data exchange between warehouse activity and other operational systems
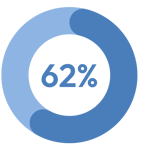
62% No Barcode Scanning
No scanning infrastructure deployed despite active ERP use in nearly every case

75% Inventory Visibility Gaps
Could not reliably confirm quantities or locate inventory across their operations

65% Prior WMS Lacked Functionality
Where the Problems Were Concentrated
The study tracks five pain dimensions based on operational performance concepts reflected in the ASCM Supply Chain Operations Reference (SCOR) model. A single operational condition can contribute to more than one pain dimension. The dimensions are overlapping lenses on the same operational environment,
not mutually exclusive categories.
 100% Process & Technology Friction
 75% Inventory Visibility & Accuracy
 60% Labor & Resource Inefficiency
 50% Execution & Throughput Bottlenecks
 34% Quality, Compliance & Risk
Process and technology friction appeared in all 100 evaluations. It was the primary evaluation driver for 67% of companies. The remaining 33% arrived with a more complex problem already in motion — meaning a second or third pain dimension was the primary reason for seeking a solution.
Inventory visibility and accuracy appeared in 75% of companies. Three out of four operations in this sample could not reliably confirm what inventory they had or where it was located. In 22% of cases it was the primary driver of the evaluation.
Quality, compliance, and risk appeared in 34% of companies. That figure is likely a floor. Companies may carry compliance or quality risks that are not immediately apparent at the outset of an evaluation. As the operational picture becomes more complete, those risks tend to come into view.

Four Operational Failure States
What the Data Produced When Organized by What Was Breaking
The four profiles that emerged from this analysis are each defined by which pain dimensions were active at the same time — not by industry, revenue, or headcount. That was not the starting assumption. It was what the data showed.
Two companies in the same industry at the same revenue can sit in entirely different profiles. The profile predicts what a solution must address. Revenue does not.

Analog Operator
33% - No system exists
73% of companies in this profile are first-install buyers. The warehouse runs on paper, spreadsheets, and delayed ERP entry. Nothing connects physical warehouse activity to the system of record in real time. The defining signal is absence — of scanning infrastructure, of real-time visibility, and of any directed workflow between the floor and the ERP.
Avg. pain dimensions: 2.7
Manual processes: 88%
No scanning: 67%
Top priorityHardware: (94%)
Throughput Ceiling
33% - System hit its limits
64% are replacement buyers. A system was in place but could no longer keep pace with volume, channel complexity, or location growth. Workers bypass the system because it is too slow or cannot support the workflows required. Picking and packing — where fulfillment constraints become visible — is the top reported operational priority at 55%.
Avg. pain dimensions: 3.0
Manual processes: 88%
Scalability concerns: 49%
Top priorityHardware: (97%)
Regulated Operator
17% - Compliance as the forcing function
An external compliance requirement converted a known operational gap into a deadline. Some are first-install buyers under compliance pressure. Others have existing systems that cannot produce the documentation or traceability regulators require. Paper-based operations and cycle counting pain each appear in 53% of this profile — and in most cases they appear together.
Avg. pain dimensions: 3.5
Manual processes: 88%
Integration concerns 88%
Top priorityHardware: (100%)

Full System Breakdown
17% - Everything failing simultaneously
59% already have warehouse technology in place. It is not working. With an average of 4.3 active pain dimensions — the highest of any profile — these operations are not dealing with one category of problem. Location management failures, inventory inaccuracies, picking errors, and compliance exposure often co-exist. The evaluation is not exploratory. It is urgent.
Avg. pain dimensions: 4.3
Manual processes: 94%
Disconnected systems: 76%
Top priorityHardware: (100%)
Shared Baseline Conditions Across All Four Profiles
All four profiles share the same operational floor. Manual processes, no scanning, and disconnected systems appear at high rates across every profile. These are the universal conditions of the SMB warehouse gap — present regardless of which failure state the operation is in.
| Condition | Analog Operator | Throughput Ceiling | Regulated Operator | Full System Breakdown |
|---|---|---|---|---|
| Manual Processes | 88% | 88% | 88% | 94% |
| No Scanning | 67% | 61% | 59% | 59% |
| Disconnected Systems | 61% | 70% | 71% | 76% |
| Real-Time Visibility Gaps | 64% | 42% | — | — |
| Scalability Concerns | — | 49% | — | 53% |
| Cycle Counting Pain | 42% | — | 53% | — |
| Location Management Gaps | — | — | — | 53% |
Prior Technology Failure
46 of 100 Companies Arrived With
Existing Warehouse Technology
These were not operations starting from scratch. They had invested in a WMS, barcode scanning system, or other warehouse technology — yet arrived at a replacement evaluation. Process and technology friction, disconnected systems, and manual workarounds remained active across most of that group.
Among companies with prior warehouse technology, the most common outcome was a system that could not fully support what the operation required. This study was not designed to identify the exact reasons why. Based on RF-SMART's experience working with more than 2,800 customers across 40 countries, this tends to occur when operational requirements are not scoped completely at the outset, when functionality is overpromised, or some combination of both. What this sample documents is the outcome: 65% of prior-technology companies reported their system lacked the functionality their operation required.

65% WMS Lacked Required Functionality
The existing system could not support the workflows, controls, or operating conditions the warehouse required. The most common failure pattern by a significant margin.

17% Deployed but Bypassed by Workers
A WMS or scanning solution was available but workers did not use it consistently. Systems with excessive clicks or slow response times are abandoned. Workers revert to paper because it is faster.

11% Hardware Purchased Without WMS Software
Barcode scanning hardware was acquired without the software needed to direct work and connect scan activity to the ERP. The hardware was stranded. Scanners sat unused because the bridge between scanning and system was never built.

7% Implementation Degraded Operations
A deployed solution introduced delays into previously acceptable processes. The smallest failure pattern but arguably the most damaging — organizational resistance to the next technology investment follows.
A Better Starting Point
Evaluate the Operational State, Not the Company Profile
Revenue, headcount, industry, and warehouse complexity all provide useful context. None of them, on their own, identify the operational problem a company is trying to solve or determine whether a warehouse system can resolve it.
A reliable evaluation begins with the operation's current failure state: what is breaking, how those failures are compounding, and what controls the next solution must support. These 100 companies show that an ERP, a scanner, or an entry-level WMS does not on its own ensure that warehouse activity is directed, validated, and recorded in the system of record as work happens.
The distinction between a company establishing that infrastructure for the first time and one replacing a system that could not sustain it matters. It matters to the evaluation and to the solution.
Where Each Profile's Evaluation Should Begin
Analog Operator Establishing the FoundationThe evaluation begins with the gap between physical warehouse activity and the ERP. The priority is identifying which transactions are still recorded after work is completed — receiving, putaway, picking, transfers, and counts — and what must be scanned at the point of work to eliminate those gaps. |
Throughput Ceiling Removing the Workflow ConstraintsThe evaluation should focus on where the current process or system limits speed, capacity, and scalability. The system must support the required workflows at current volume and at projected future volume, without creating new manual workarounds in place of the old ones. |
Regulated Operator Protecting Traceability and ComplianceThe evaluation begins with the records and controls the operation must maintain. The technology must enforce required controls at the point of work — lot tracking, expiration validation, FIFO or FEFO, required scanning steps — and maintain complete records across the ERP and any required external systems. |
Full System Breakdown Stabilizing Multiple Failure PointsThe evaluation must account for connected failures rather than treating each symptom separately. The first priority is identifying which failures create the greatest immediate operational or customer impact, then tracing those to their upstream causes. The solution must address related workflow, data, and process-control gaps together — not as separate fixes. |

The SMB Warehouse Operations Gap
The Five Levels of Warehouse Complexity
Hidden Complexity & Pain Dimensions
The Four Warehouse Operator Profiles Defined by What's Breaking
Profile 1: Analog Operator
Profile 2: Throughput Ceiling
Profile 3: Regulated Operator
Profile 4: Full System Breakdown
Why Warehouse Management Systems Fail
Download the PDF