
The Key Finding: The Complexity the Market Misses
Across the full sample of 100 companies, 79% were classified at L2 or above. Among the 86 companies with available revenue estimates, 68 were estimated below $25 million in annual revenue. Of those 68 companies, 71%, were classified at Standard (L2) warehouse complexity or above.
Table 2b shows how warehouse complexity varied across estimated revenue bands.
| Estimated Annual Revenue | Companies | Share of 86 | L2 or Above | L3 or Above |
|---|---|---|---|---|
| Under $10M | 49 | 57% | 31 (63%) | 8 (16%) |
| $10M-$25M | 19 | 22% | 17 (89%) | 7 (37%) |
| Under $25M | 68 | 79% | 48 (71%) | 15% (22%) |
| $25M-50M | 5 | 6% | 5 (100%) | 2 (40%) |
| $50M-$100M | 10 | 12% | 10 (100%) | 6 (60%) |
| $100M-$250M | 3 | 3% | 3 (100%) | 3 (100%) |
| $25M and Above | 18 | 21% | 18 (100%) | 11 (61%) |
| No Usable Revenue Estimate | 14 | - | - | - |
Table 2b. Warehouse Complexity by Estimated Revenue Band
Note: All revenue estimates are directional. The bands at $25M and above are small (5, 10 and 3 companies),
their percentages should be read as indicative only.
These findings show that smaller companies can have warehouse requirements that revenue alone does not reveal. Operational requirements do not disappear because the company generating them is small. This report defines hidden warehouse complexity as operational requirements that are present and measurable yet not fully captured by company-level measures such as revenue and headcount. A warehouse evaluation must examine the workflows, inventory controls, and system connections the operation requires.
What the Pain Looks Like
Process and technology friction were reported by 100% of companies in this sample, making it the baseline condition of SMB warehouse operations. Where companies differ is how many additional pain dimensions are active at the same time. Table 3 breaks down the five pain dimensions observed across the dataset.
While process and technology friction appears in every company, it serves as the universal baseline. On its own, it cannot describe the full picture of what an operation is going through. For two-thirds of companies, process friction is not where the problem ends, many are managing execution strain, compliance exposure, or both on top of the baseline.
Inventory visibility and accuracy is the second most prevalent dimension at 75%, meaning three out of four companies cannot trust their own inventory data. In 22% of cases, the inability to confirm quantities and locate inventory across their operations is the primary reason for seeking a solution.
Labor and resource inefficiency appears in 60% of companies, reflecting operations that are throwing people at problems a system should handle. This manifests as institutional knowledge dependencies, labor-intensive manual tasks, and difficulty training new staff. Despite its prevalence, it is rarely the primary evaluation driver, because companies tend to frame their evaluation around systems and data, not headcount.
Execution and throughput bottlenecks affect half the sample, with picking, receiving, and shipping bearing the constraint in operations that are either too slow or unable to scale. Quality, compliance, and risk round out the picture at 34%, surfacing as picking errors, lot tracking failures, regulatory exposure, and financial leakage. That figure is likely a floor: companies may carry quality or compliance risks that are not immediately apparent, particularly in regulated industries. As the operational picture becomes more clear, those risks often come into view.
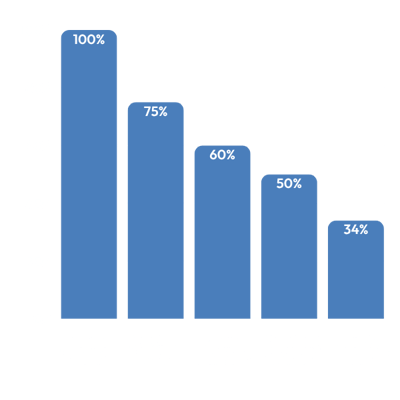
Table 3. Five Pain Dimensions
| Pain Dimension | Prevalence |
|---|---|
| Process & Technology Friction | 100% |
| Inventory Visibility & Accuracy | 75% |
| Labor & Resource Inefficiency | 60% |
| Execution & Throughput Bottlenecks | 50% |
| Quality, Compliance, & Risk | 34% |
Table 3. Five Pain Dimensions
The 15 Most Common Operational Conditions
While pain dimensions describe the category of problem, operational conditions
describe what it looks like on the warehouse floor.
Table 4 identifies the 15 most common operational conditions observed across the dataset. Each condition was identified and tagged at the specific-behavior level. A single condition can contribute to multiple pain dimensions simultaneously. For example, manual data entry is both a process friction and a labor inefficiency condition.
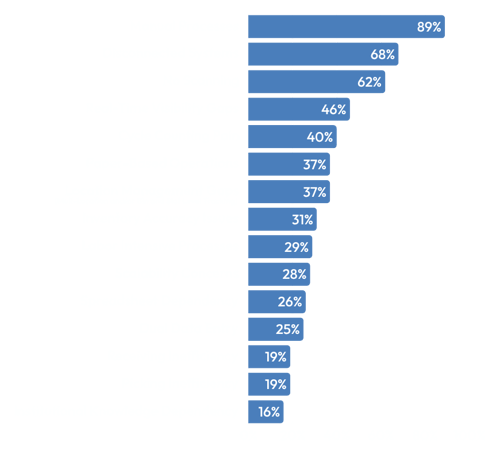
Table 4. Most Common Operational Conditions
Note: The 46% figure captures explicit real-time visibility gaps. A broader measure of whether companies could reliably determine what inventory they had and where ranged from 60–63%. The table retains the more narrow measure.

|
1. Manual Processes 
89% of the sample report manual processes as part of their warehouse operation. This manifests in different ways and to different degrees. Some companies are entirely manual, running on paper and spreadsheets with no system at all. Others have technology deployed but still rely on manual workarounds because the system cannot fully support what the operation requires. Both are represented in this dataset.
Gartner's warehouse complexity framework classifies these companies at Levels 1 and 2, where basic to standard WMS functionality should be sufficient. The data suggests the reality is more nuanced. What varies is whether the solution in place can fully support what the operation actually requires. This gap between classification and operational reality is hidden warehouse complexity in its most common form. In practice, manual work means writing pick lists on paper, walking to check stock levels, counting inventory by hand, and entering data into the ERP after the fact. These are not preferences. They are what the operation defaults to when the right technology is not in place. |

|
68% have disconnected systems, meaning the ERP and the warehouse operate independently, with no real-time exchange between them. This includes companies whose integration has failed and companies with no WMS connection between the warehouse and ERP in the first place. In both cases, inventory data lives in multiple places with no consistent agreement across records. |

|
62% have no barcode scanning capabilities deployed, leaving no systematic way to capture data at the point of action. Every pick, receipt, and transfer depends on manual entry after the fact. |

These three conditions (manual processes, disconnected systems, and no barcode scanning) form the operational foundation of the SMB warehouse gap. They co-occur because they are structurally related. Without scanning, processes remain manual. Without integration, systems remain disconnected. Each one reinforces the others.
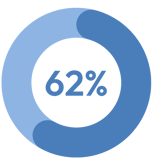
Barcode Scanning: 62% of Companies Operate Without It
62% of companies in this sample have no barcode scanning deployed in their warehouse operation. They have an ERP, and many have been operating on that ERP for years. But nothing connects the physical movement of goods to the system of record in real time.
This is not a technology adoption lag. It is a gap between what the ERP provides and what warehouse operations require. ERPs manage transactions but do not direct warehouse work. The assumption that an ERP's inventory module constitutes warehouse management is one of the most common misconceptions in this market segment.
Among the 46% of companies that arrived with prior technology, 11% had purchased barcode scanning hardware but had no WMS software connecting it to their ERP. The hardware was stranded. The scanners sat unused because the bridge between scanning and system was never built.
|
46% had prior technology, 11% had hardware but no WMS. |
The consequence is predictable. Without scanning, every pick, every receipt, every transfer, and every count depends on a person remembering to record it, recording it correctly, and recording it promptly. The failure rate across all three compounds daily.

 The SMB Warehouse Operations Gap
The Five Levels of Warehouse ComplexityHidden Complexity & Pain Dimensions
The Four Warehouse Operator Profiles Defined by What's Breaking
Profile 1: Analog Operator
Profile 2: Throughput Ceiling
Profile 3: Regulated Operator
Profile 4: Full System Breakdown
Why Warehouse Management Systems Fail
Download the PDF